PayTraQer Analytics Dashboard - Overview
August 6, 2024
Business Analytics dashboard in PayTraQer
The Business Analytics dashboard gives you key sales, expense, and accounting insights from your QuickBooks company inside PayTraQer.
You can review numbers, trends, and aging reports without opening QuickBooks.
Video Tutorial for How to Set Up PayTraQer in QuickBooks Online for E-commerce Bookkeeping:
Data on this screen comes from:
Your connected QuickBooks Online company
Historical transactions synced through PayTraQer
It is read only. No entries are created or edited from this dashboard.
How to open the dashboard
Sign in to PayTraQer.
Choose the company from the Company dropdown at the top left.
Click the Business Analytics tab.
Below that you have three tabs:
Sales
Expenses
Accounting
Sales tab
The Sales tab focuses on revenue and receivables. Most widgets use bar charts grouped by month.
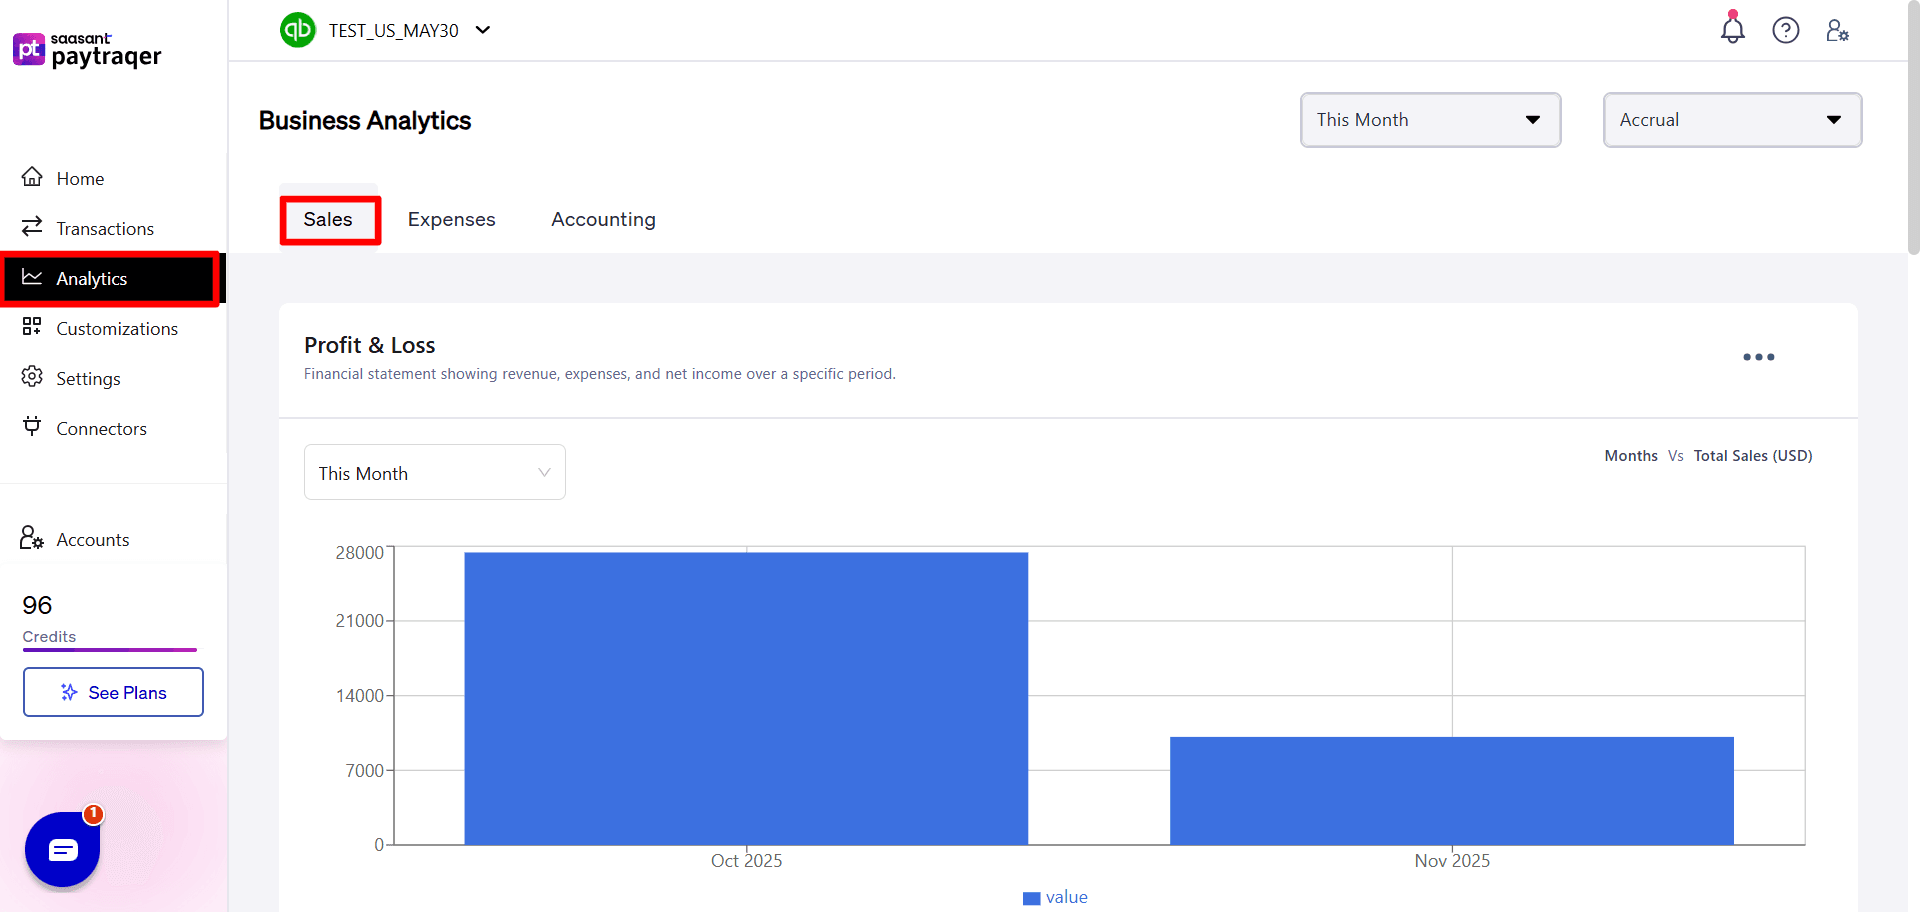
Profit & Loss (Sales trend)
Description: Financial statement showing revenue, expenses, and net income over a specific period.
Chart type: bar chart
Axis: Months vs Total Sales (USD)
Use it to see how total sales move over time.
Cash Flow
Description: Movement of money in and out of the business, including sales, expenses, and investments.
Chart type: bar chart
Axis: Months vs Total Sales (USD)
Shows monthly net cash movement based on accounting data.
Invoices
Description: Invoices and statement charges for goods or services provided with totals for each customer.
Chart type: bar chart
Axis: Months vs Total Sales (USD)
Helps you see billed revenue by month.
AR Aging Summary
Description: Report detailing outstanding customer invoices grouped by due date.
Chart type: bar or stacked chart
Buckets: Current, 1–30, 31–60, 61–90, 91 and over
Axis: Months vs Total Sales (USD)
Shows how much customers owe in each aging bucket.
Sales by Product/Services
Description: Breakdown of revenue generated by different products or services.
View: table
Columns: Description, Date, Amount
Shows each product or service with monthly amounts
This helps you see which items generate the most income.
Sales by Customer
Description: Analysis of revenue generated from individual customers.
View: table
Columns: Description (customer), Date, Amount
Shows total billed or collected per customer for the selected period.
If there is no data, you will see a “No data” message.
Expenses tab
The Expenses tab focuses on payables and vendor spend.
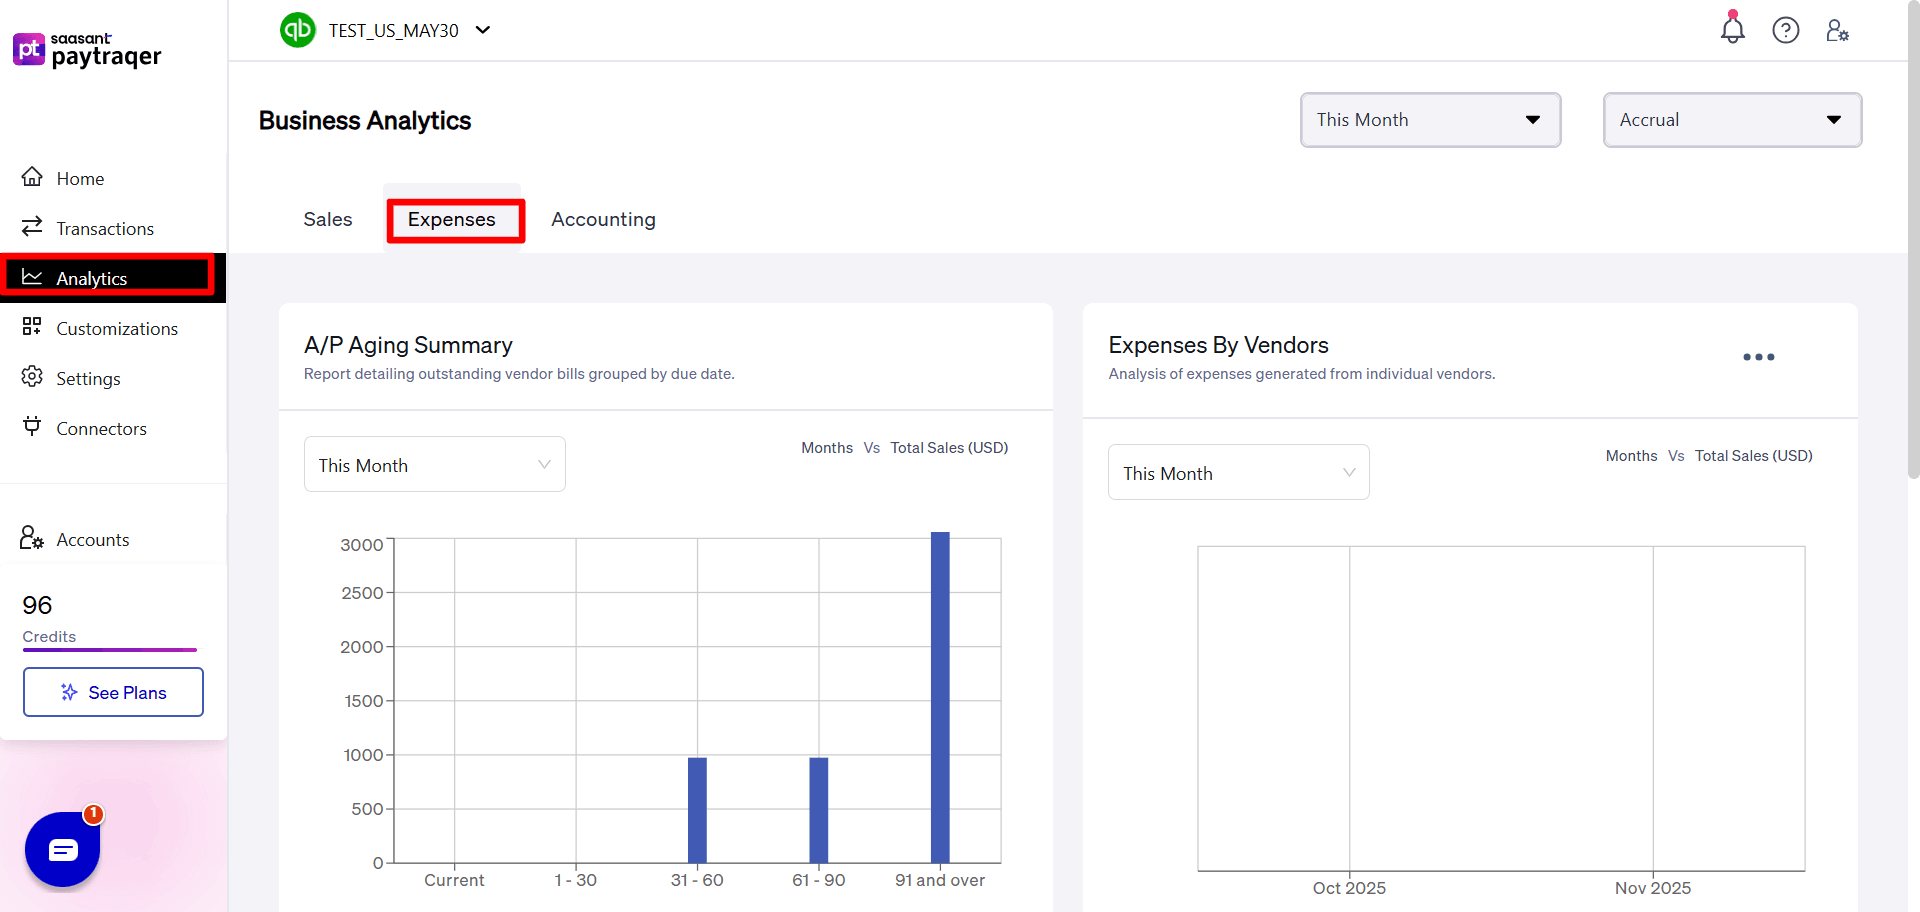
A/P Aging Summary
Description: Report detailing outstanding vendor bills grouped by due date.
Chart type: bar or stacked chart
Buckets: Current, 1–30, 31–60, 61–90, 91 and over
Axis: Months vs Total Sales (USD)
Shows how much you owe vendors and how overdue it is.
Expenses by Vendors
Description: Analysis of expenses generated from individual vendors.
Chart type: bar chart
Axis: Months vs Total Sales (USD)
Lets you see which vendors account for most of your spend over time.
Unpaid Bills
Description: Report detailing the unpaid bills for each vendor by due date.
Chart type: bar chart or summary number
Axis: Months vs Total Sales (USD)
Shows total unpaid bills.
Bills
Description: Report detailing the paid bills for each vendor by due date.
Chart type: bar chart or summary number
Axis: Months vs Total Sales (USD)
Shows totals for paid bills in the selected period.
Accounting tab
The Accounting tab gives higher level accounting reports similar to what you see in QuickBooks.
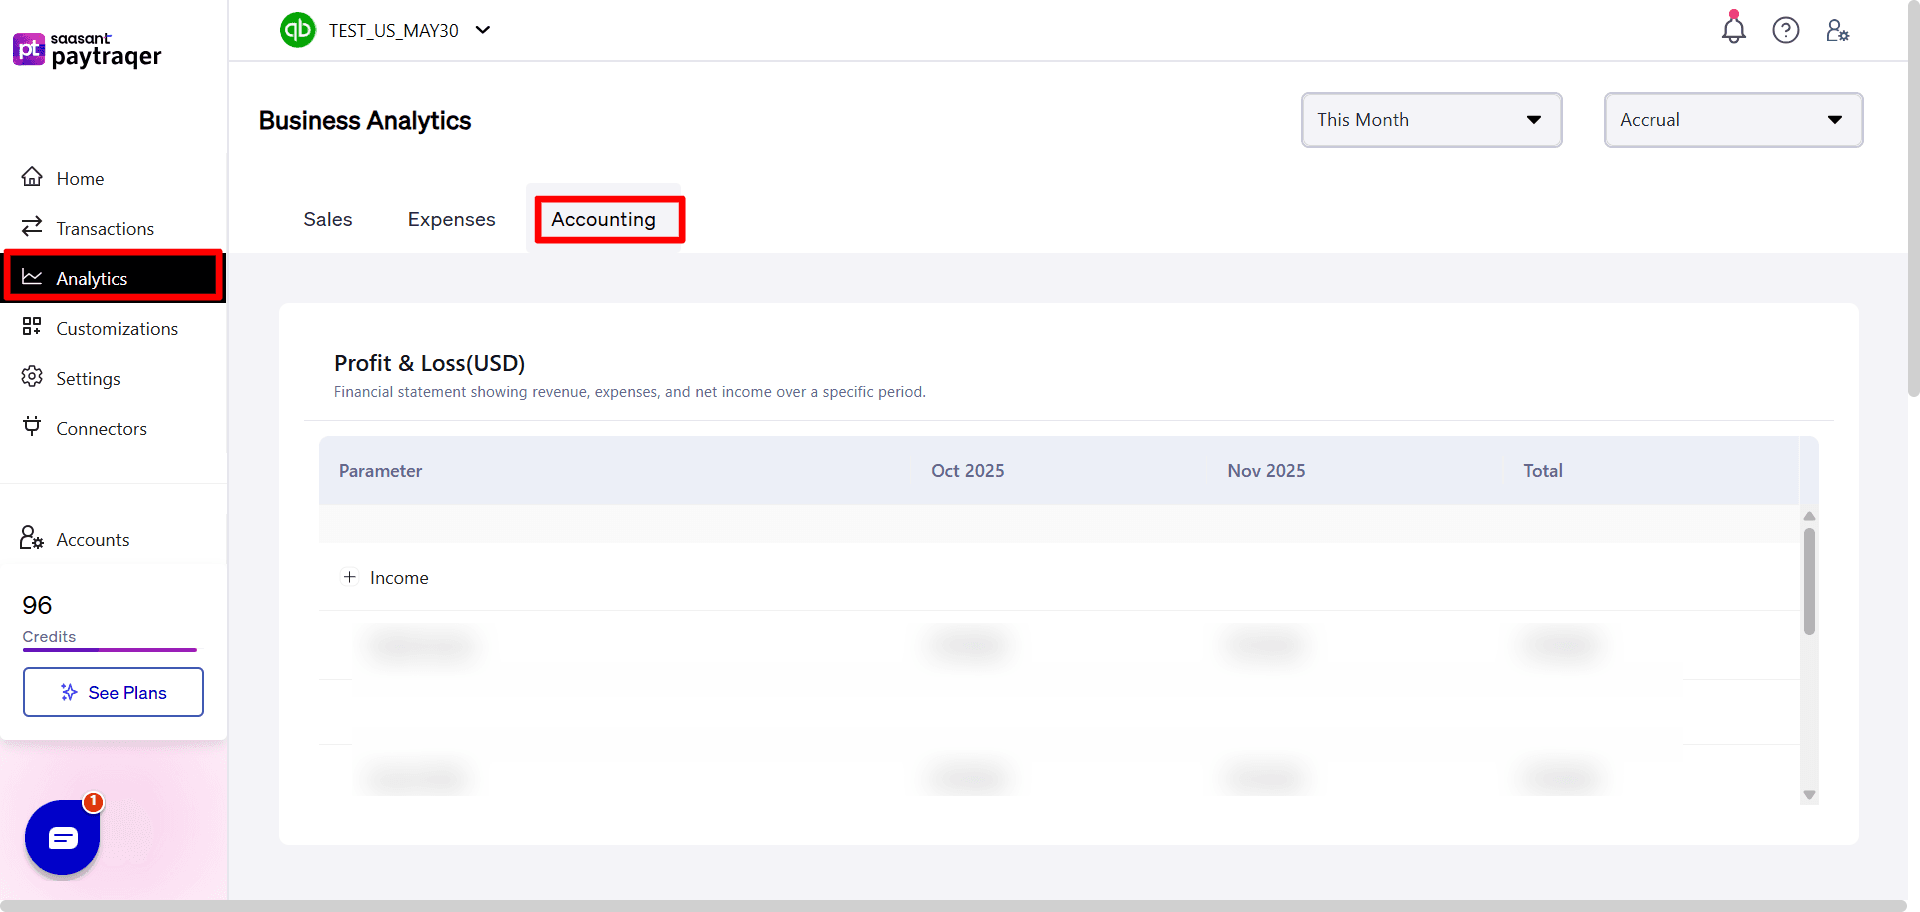
Profit & Loss (USD)
Description: Financial statement showing revenue, expenses, and net income over a specific period.
View: table
Columns: Oct 2025, Nov 2025, Total (months will change based on data)
Key rows:
Total Income
Gross Profit
Total Expenses
Net Operating Income
Net Income
Use this to confirm monthly and total profitability from inside PayTraQer.
General Ledger
Description: The total balance of financial transactions for each account from your chart of accounts.
View: account summary table
Shows accounts such as:
Bank accounts (Checking, PayPal Bank Account, Shopify Bank Account, Stripe Bank Account)
Accounts Receivable and Accounts Payable (including multi currency versions)
Inventory Asset
Income accounts (Sales of Product Income, Uncategorized Income)
Expense accounts (PayPal Fees, Uncategorized Expense, Utilities)
Liability and equity accounts (Loan Payable, Retained Earnings, Board of Equalization Payable)
For each account you see the total balance for the selected period.
This gives you a quick view of account balances without opening QuickBooks reports.
Trial Balance
Description: Summary of all accounts to ensure debits and credits balance for the period.
View: table
Columns: Debit, Credit
Shows accounts like Checking and the overall TOTAL line.
Debits and credits should be equal for the selected period.
Use this to confirm that your books are in balance.
What this dashboard is for
The Business Analytics dashboard is designed to:
Give you a quick view of sales, expenses, AR, and AP
Show key accounting summaries without opening QuickBooks
Help you spot trends and issues while you work inside PayTraQer
You can switch companies from the dropdown at the top and review the same set of reports for each connected QuickBooks company.
If a widget shows no data or unexpected values, first confirm that:
The company is connected and synced in PayTraQer
The correct QuickBooks file is selected in the company dropdown
The period actually contains transactions
If data still looks wrong after a fresh sync, contact support with screenshots of the dashboard and the matching QuickBooks reports so we can help you compare them.